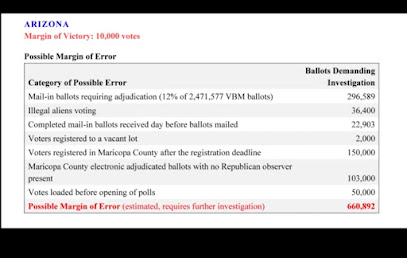
The following charts show in detail the problems with election results in the problem states and why there are multiple good reason to doubt the validity of those elections. Study the charts, watch the video below, then make up your own mind. Make a note of the margin of victory by Biden posted at the top compared to the magnitude of questionable voting. Another fact to ponder ...why is it that when votes come into question about their validity, why is it that those votes seem to be cast for Democrat candidates? 😕 Click on photos for larger image Arizona Georgia Michigan Nevada Pennsylvania Wisconsin Watch the video here for more details: https://michaeljlindell.com/ http://performancempg.com/

